
Your Lambdas are failing and you don't even know!
How to achieve Serverless observability on AWS with SLIC Watch


Do you build serverless applications on AWS using Serverless Application Framework? Yes?! 😻
Serverless is a godsend, but in this perilous cloud world, failure is always around the corner. So, how can we set up dashboards and alarms to stay on top of our deployments in case something goes wrong? 🙀
Let me tell you how we can do this with minimal effort™️ 😼

Observability is a tricky business
In AWS land, the main tool for observability is CloudWatch. Great name for such a service, but I personally find that creating CloudWatch dashboards and alarms for Serverless applications is a bit of a pain. This is true whether I do it manually by clicking around in the AWS web console or programmatically by using in-line CloudFormation code baked in my serverless.yml configuration.
I heard similar stories from others, so I am sure I am not alone in this struggle...
Certainly, it takes a lot of time to set up dashboards and alarms, but even before we start creating them, there is the big question of "WHAT SHOULD WE EVEN LOOK FOR?"
The universal answer to this question seems to be "it depends"... And that's not an evasive answer, I swear!
In fact, healthy normals depend entirely on how we designed the application and its underlying architecture. We really need to understand how the whole distributed system is connected and what are the signs that something is going wrong. Once we know that, it becomes more apparent what needs monitoring.
There's a wealth of documentation regarding what to look for and many interesting industry best practices we can refer to.
If you want to embark on this journey and become an observability expert, the best place to start is probably The Well-Architected Framework maintained by AWS.
This is certainly a beautiful journey, but a long one! What if you don't have the time or resources to focus on this right now? 😿
Should we give up on observability entirely, or is there a way to cover the majority of our observability needs without having to become experts and spend countless hours writing configuration? 😾
An easier approach to serverless observability
This question has kept us busy at fourTheorem lately. We have seen many of our customers struggle with observability and this is what we have come up with to try and ease this pain:
SLIC Watch is an open-source Serverless framework plugin that will AUTOMATICALLY look into your stack, and enrich it with CloudFormation dashboards and alarms for the resources you are using (Lambdas, queues, DynamoDB tables, etc.).
Alarms and dashboards are based on best practices. For instance, if you are using an SQS queue, SLIC Watch will add an alarm to make sure you are processing the messages fast enough. If you are using a Lambda you'll have alarms to be notified of failures! 😺
So yeah, if we use SLIC watch we can easily know when our Lambda functions are exploding and we can take action. Don't trust the grumpy kitten in the cover picture of this article: it's totally NOT fine to ignore Lambda errors...
Ok, if this idea sounds appealing to you, where do we start?
Getting started with SLIC Watch
The best thing about SLIC Watch is that we can add it to our apps in minutes!

We only need to follow 4 simple steps...
1. Install the plugin 📦
As with any other Serverless plugin, we can install SLIC Watch from npm:
npm install serverless-slic-watch-plugin --save-dev
2. Enable the plugin in your serverless.yml 🖋️
Again, pretty standard stuff. We just need to enable the plugin in our serverless.yml:
# ... more config

plugins:
  - serverless-slic-watch-plugin

# ... some moar config
3. Configuration (optional) 🪛
Optionally, we can add configuration to customize the behavior of the plugin (enable/disable certain types of dashboards and alarms or change thresholds).
To do that we can use the custom block and add a slicWatch section in the serverless.yml
# ... more config

custom:
  slicWatch:
    topicArn: {'Fn::Ref': myTopic}

# ... some moar config
4. Deploy! 🚀
The usual way... just run:
sls deploy
The result
Now, if we have a look at our CloudWatch console, we should see some new cool dashboards and alarms and our project should be much more "observable" than before. 😽
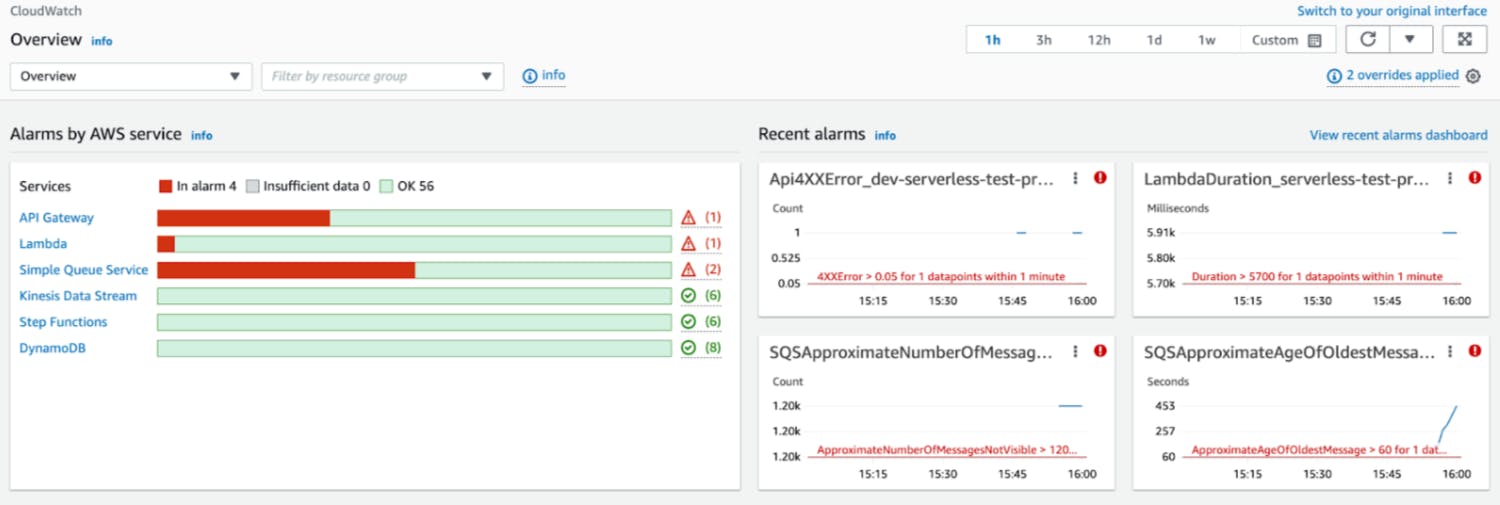
In the picture above, we can see an example of how our CloudWatch dashboard will look with SLIC Watch added to our Serverless framework application.
In this example Serverless application we are using API Gateway, Lambda, SQS, Kinesis, Step Functions, and DynamoDB.
As we can see here, we automatically got visibility into all these services with very minimal effort!
As we said, everything is configurable, so check out SLIC Watch documentation in case you want to change or disable something!
You can be part of this 🙌
SLIC Watch is open-source (and by the way totally FREE!) so you are most welcome to give us feedback, file a bug, request new features, and even contribute to the project.
Check out the GitHub repository if you want to do any of that.
We look forward to seeing how SLIC Watch will simplify shipping and monitoring high-quality Serverless applications for you!
Don't be shy and let us know what you think! 😻